Adventure Works Quarterly Report
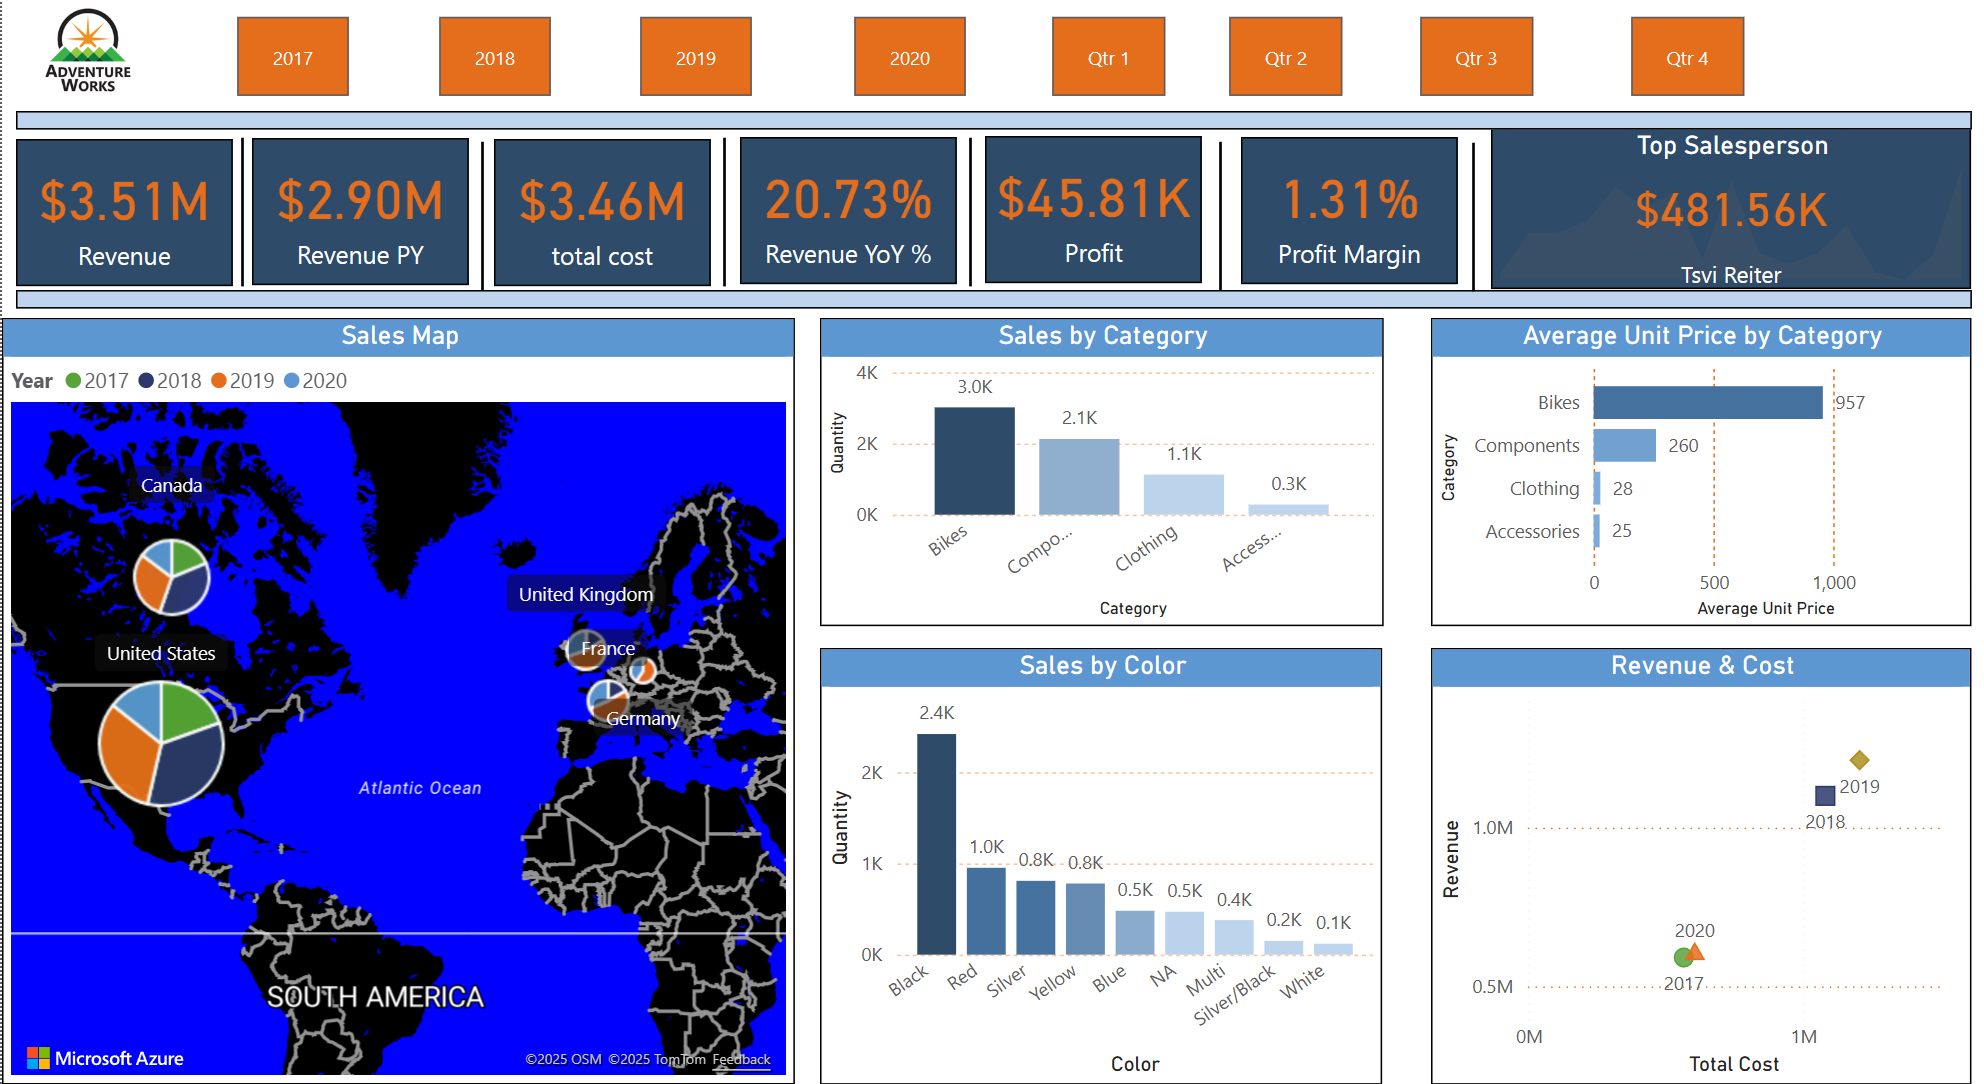
Executive Summary
This comprehensive report provides interactive insights into Adventure Works' business performance, focusing on key metrics across revenue, costs, and profitability.
💰 Revenue & Profitability
- Revenue trend analysis
- Cost structure breakdown
- Profit margin tracking
- Year-over-Year growth
🏆 Sales Performance
- Top performing salespeople
- Product profitability analysis
- Color preference trends
- Sales volume metrics
🌍 Geographical Analysis
- Regional revenue distribution
- Market growth patterns
- Territory performance
- International expansion
Key Findings
- Revenue shows steady growth but costs are increasing proportionally
- Top salesperson achieved $481.56K in sales
- Bikes are the most profitable product ($957 avg price, 3K units sold)
- Black is the most popular color (2.4K items sold)
- US market leads with $2.39M of total $3.5M revenue
- European markets show strong growth (350% YoY in France and UK)
Recommendations
- Focus on cost optimization to improve profit margins
- Expand successful product lines in European markets
- Develop targeted sales strategies based on regional performance
- Invest in top-performing sales territories
Supermarket Sales Dashboard
A comprehensive analysis of supermarket sales data, providing insights into sales patterns, product performance, and customer behavior.
📊 Key Features
- Sales trend analysis
- Product performance metrics
- Customer segmentation
- Regional sales distribution

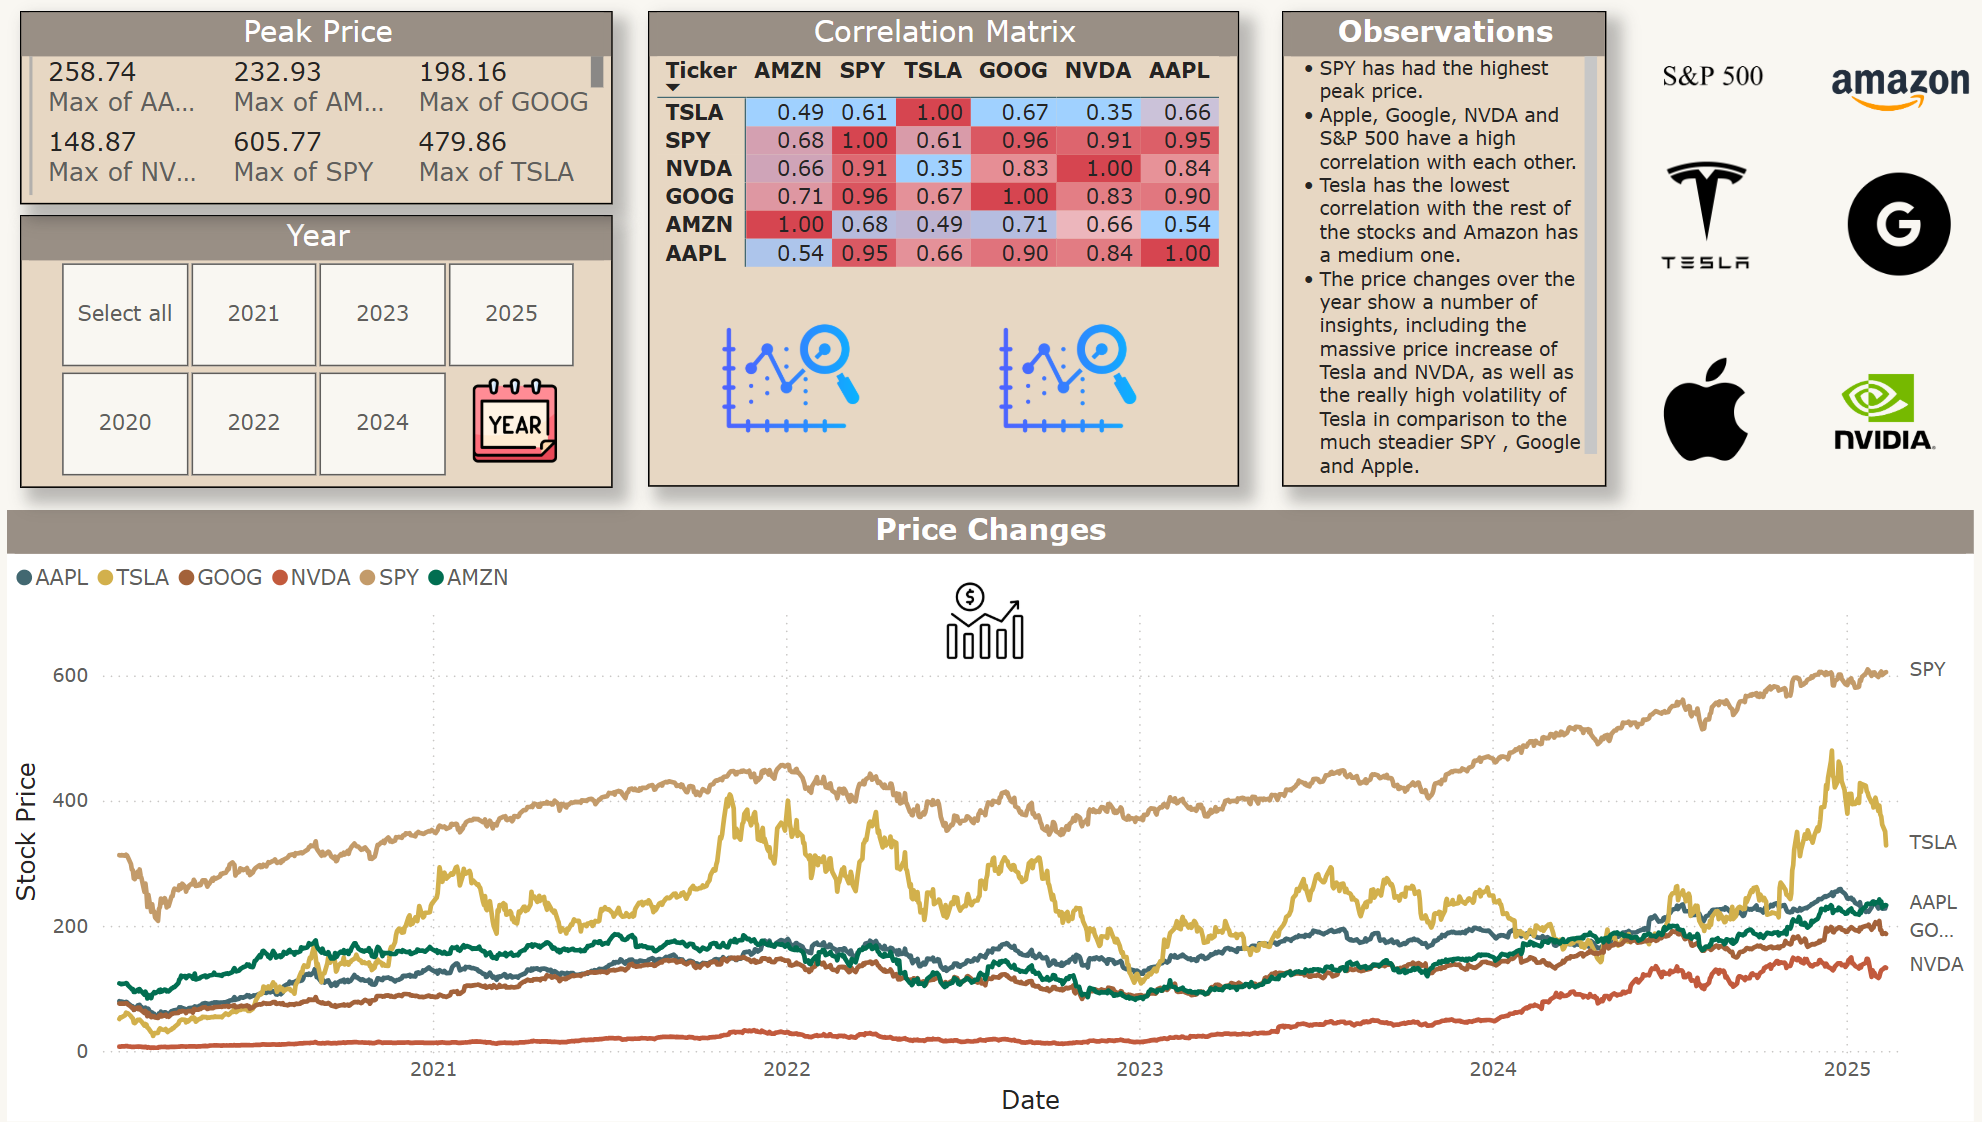
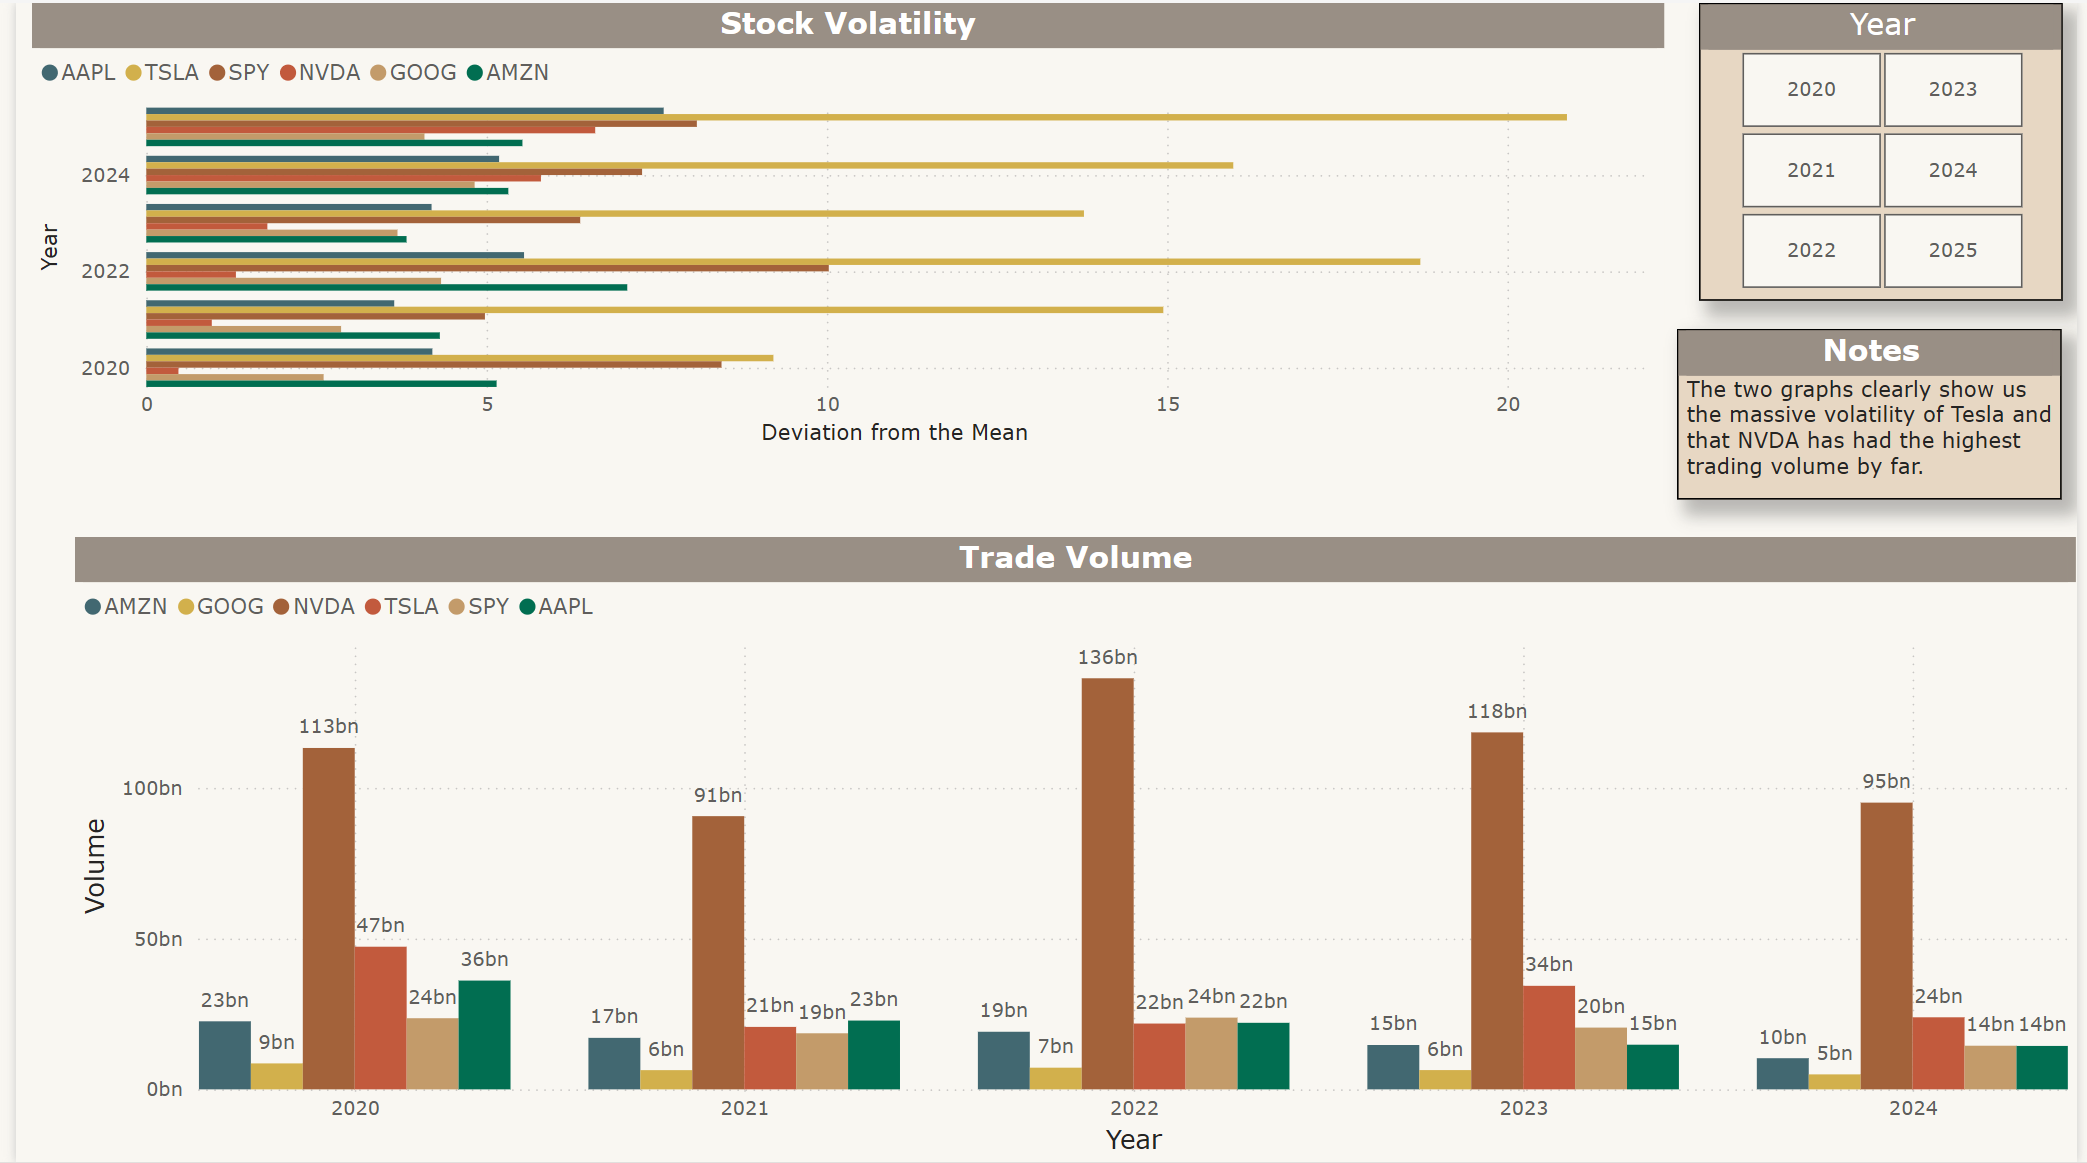
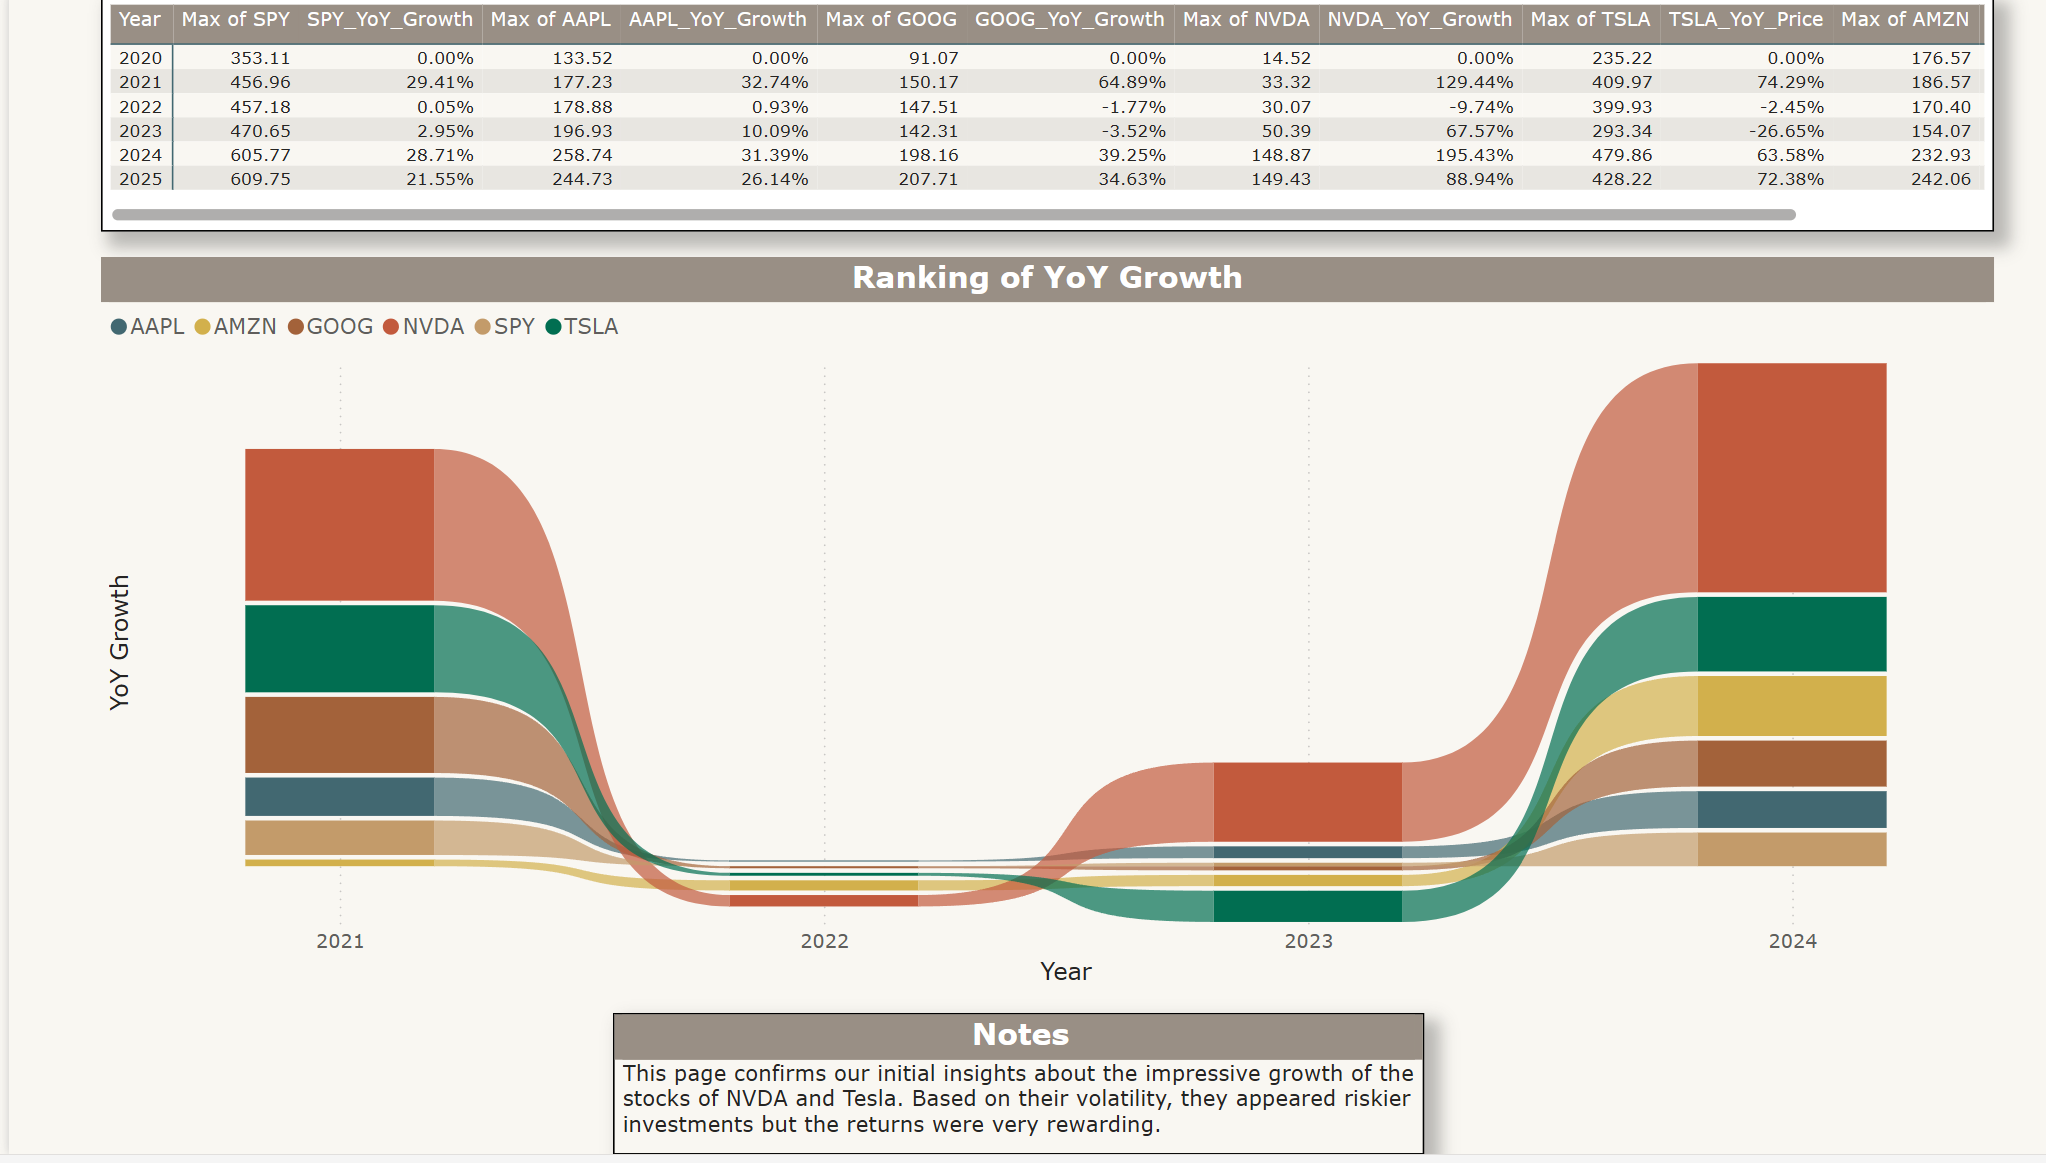
Stock Market Analysis Report
An interactive dashboard analyzing stock market trends, volume patterns, and year-over-year growth metrics.
📈 Analysis Features
- Volume analysis
- Standard deviation tracking
- Year-over-Year growth
- Market trend visualization